Most marketers open Google Analytics, stare at a wall of charts, and leave with a number but no answer. The reading is easy. The analyzing is the hard part.
As of August 2026, Google has built the analysis directly into both products. Here is the method and how to use the new tools to run it.
The short answer
Reading and analyzing your Google data comes down to five steps:
Start with what changed. Open the AI Overview at the top of the Google Analytics homepage. It tells you what moved since your last login instead of making you hunt for it.
Ask why in plain English. Click any insight card to carry it into Ask Advisor, then ask why it happened. You get a written explanation built on your own account data.
Build the report by describing it. In Google Ads, open Dashboards and type what you want to see. Every report generates its own summary explaining the trend.
Compare against similar businesses. Ask Advisor in Analytics to benchmark your campaign performance against anonymized averages from businesses like yours.
Check the data before you trust the story. A confident summary built on a broken conversion event is still wrong.
The short version of the whole thing: you no longer collect data and figure out the story. You check the story Google wrote and decide what to do about it.
Step 1. Start with what changed, not with a report
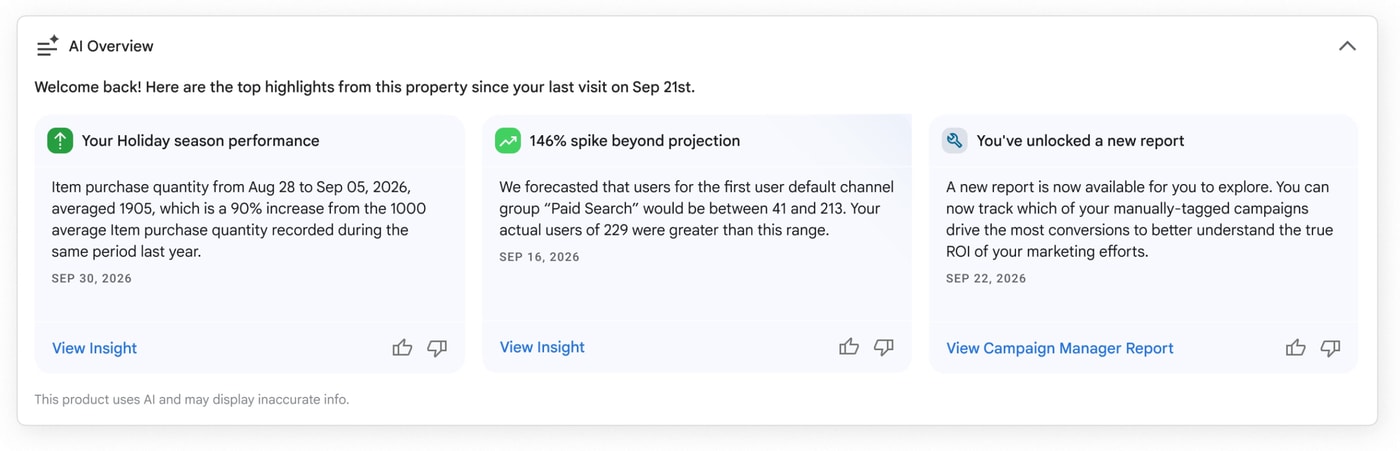
The Google Analytics homepage now opens with a written summary of everything significant that happened since you last signed in. Seasonal peaks, traffic swings, spikes above forecast, new reports you have access to.
This flips the order of the job. You used to need a hypothesis before you could query anything. Now the anomaly finds you, and you spend your time on the part that matters.
You can also opt into these summaries by phone or email at whatever frequency suits you, so the first read happens before you open the tool at all.
Step 2. Ask why in plain English
Click "View Insight" on any card and the full context travels into Ask Advisor. No rebuilding segments, no retyping the date range.
Then ask your question the way you would ask a colleague. Not "show me paid search users by day" but "why did paid search spike on September 16."
Ask Advisor answers with a written finding, then backs it with the traffic source, the region driving it, and the landing pages involved.
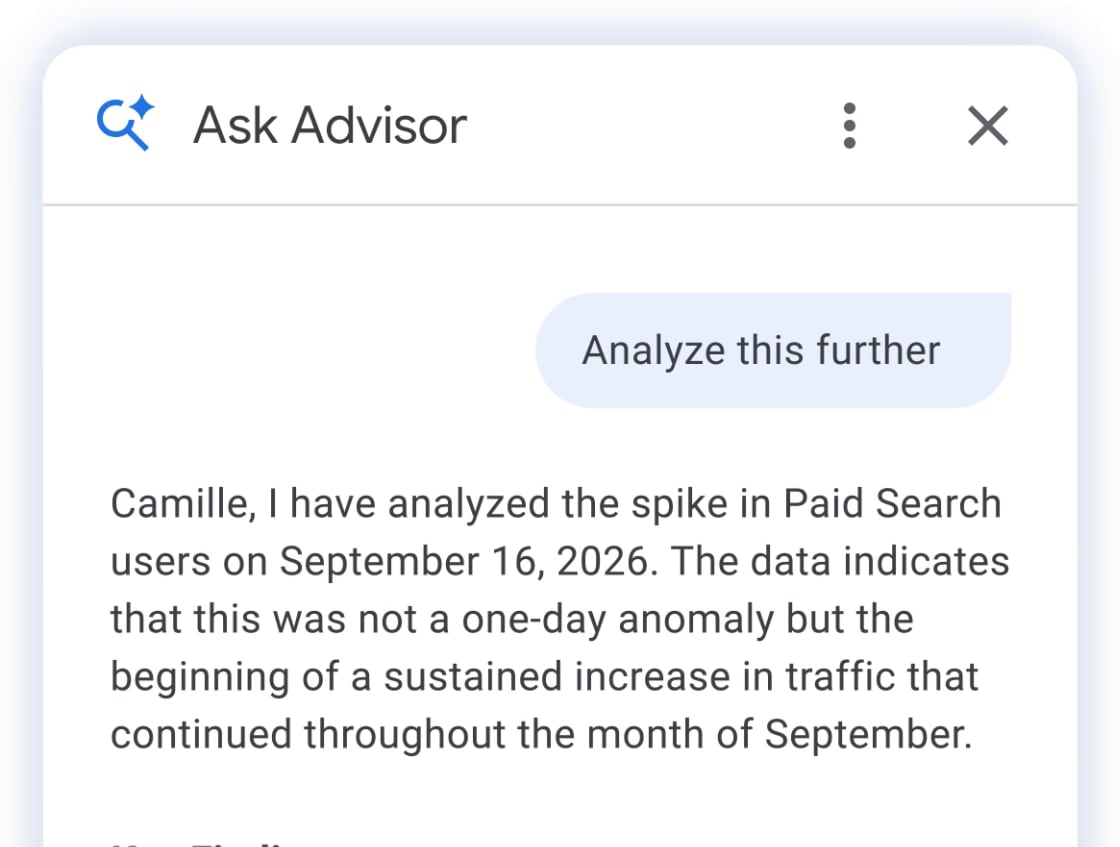
Notice what a good answer contains. Not just the chart, but the traffic source, the geography, the landing pages, and whether the spike was a one day anomaly or the start of a real trend. That is the difference between reading data and analysing it.
Step 3. Build the report by describing it
In Google Ads, Dashboards sits under Campaigns, then Insights and reports.
Dashboards lives under Insights and reports in the Google Ads left navigation.
Instead of dragging fields into a report builder, you describe what you want. You can even skip the chart request entirely and ask the diagnostic question directly, like "why is my CPV up 6.72%." The tool builds the report that answers it.
Every dashboard writes its own summary explaining what the numbers mean, above the numbers themselves.
Reporting and analysis used to be two separate jobs. This collapses them into one.
Step 4. Compare against similar businesses
Every performance review runs into the same question. Is 2.1% good? Without a reference point, the only honest answer is "compared to what?"
Benchmarking in Ask Advisor closes that gap by comparing your campaign performance to anonymised averages from businesses with similar characteristics.
This kills the worst kind of marketing argument: two people debating from instinct because neither has an external number.
Step 5. Check the data before you trust the story
This is the step people will skip, and it is the one that costs money.
An AI summary sounds equally confident whether your tracking is clean or your conversion event has been double firing since June. The explanation layer does not validate the measurement layer. It just makes bad data sound like insight, in complete sentences, on your homepage, every morning.
Before you act on any narrative, confirm three things:
Your conversion events are firing once, not twice, and are still mapped to the right action.
The date range and attribution setting in the answer match the ones you actually meant.
The number roughly agrees with a second source, like your CRM or payment dashboard.
If those three hold, trust the story. If they do not, fix the tracking first. A smarter explanation cannot repair a broken measurement.
The order to read your numbers in
Whatever tool you use, read in this sequence. Each number only makes sense in the context of the one before it.
Volume. How many people arrived.
Source. Which channel sent them.
Engagement. What they did once they landed.
Conversion. How many completed the action you care about.
Cost. What you paid for that outcome, if you are running ads.
One rule holds all of it together. Never read a number alone. Always read it against the previous period and against the channel that produced it. A 40% traffic jump means nothing until you know it came from one campaign in one country.
Questions worth asking
These get better answers than vague prompts, because each one names a metric, a scope, and a time frame.
Why did conversions drop last week?
Which campaign drove the largest change in conversions week over week?
Which channel lost the most traffic in the last 30 days, and what changed inside it?
Show me cost per conversion by campaign for the last 30 days and explain the biggest outlier.
Which landing pages lost the most conversions this month?
How am I performing compared to similar businesses?
Mistakes that make the analysis wrong
Reading a number with no comparison period. A metric without a baseline is trivia.
Confusing a tracking drop with a traffic drop. Check whether the tag broke before you blame the campaign.
Asking a vague question. "How are we doing" produces a vague answer. Name the metric and the window.
Acting on a single week. One week is noise. Two consecutive weeks in the same direction is a signal.
Averaging across channels. A blended conversion rate hides the channel that is actually failing.
FAQ
Where do I find AI Overviews in Google Analytics? At the top of the Analytics homepage. It appears automatically when you log in and summarises changes since your last visit.
Does the AI change my campaigns on its own? No. Google's advisor products describe approval boundaries before any account change is made. The agent proposes, you approve. Treat it as a review loop, not autopilot.
Is Dashboards available in Google Analytics? It launched in Google Ads first, with Google Analytics support announced as coming soon.
Can I get these insights without logging in? Yes. You can opt into the summaries by phone or email and set how often you receive them.
Do I need to be a GA4 expert to use this? No, and that is the point. The questions work in plain language. The expertise now sits in knowing which answer is worth acting on.
Where is Google's official announcement? Evolve your marketing with new AI tools, published by Google on August 10, 2026.
Grow your AI visibility with Scribble
Google is teaching its AI to explain your data. Every other AI is already explaining your category to your buyers, without you in the room.
Scribble tracks whether ChatGPT, Gemini, Claude and Perplexity cite your brand when it matters, then runs the content and creator campaigns that get you cited.
Related reading: From near zero to 9% AI share of voice in 15 days, the RocketX campaign
Check the reel on this out - https://www.instagram.com/reel/DcBcrfTA_fG/?utm_source=ig_web_copy_link&igsh=NTc4MTIwNjQ2YQ==
Written by

I’m Tanmay Tarte, a community builder at Scribble and an engineering graduate from Priyadarshini College of Engineering. Over the years, I’ve worked across community management, content, hosting, and social media, mainly within the Web3 and creator ecosystem space. Outside of work, I’m a huge sports enthusiast and can genuinely play cricket all day, every day.